
The climate crisis with increasing global temperatures is a consequence of increasing greenhouse gas concentrations in the atmosphere. The concentration of carbon dioxide, the most important greenhouse gas in the atmosphere, is driven by three major fluxes:
1. Release and uptake by land ecosystems.
2. Release and uptake by the ocean.
3. CO2 emissions from fossil fuel burning.
The land ecosystems and oceans are ‘natural sinks’ as they have taken up half of the fossil fuel emissions to date. Whether this remains the case in the near and distant future is far from certain.
Disentangling the three drivers of the atmospheric CO2 concentration and understanding each of them is crucial to support climate action.
Each of the three fluxes over Europe in 2021 is shown in a separate map. The maps show annual results. Blue areas symbolise net carbon uptake during the year, reducing the CO2 load of the atmosphere. Red areas symbolise net carbon loss adding additional CO2 to the atmosphere.
Land ecosystem fluxes over Europe show a complex pattern of net CO2 uptake or release. In regions with net uptake (blue), the uptake by photosynthesis over the year was higher than the release by respiration. In red regions it was vice versa: the carbon stored in the ground was released to the atmosphere.
The ocean fluxes are small compared to land fluxes and emissions but it has to be taken into account that oceans cover about 70% of the Earth’s surface. That makes oceans an important sink compensating for about one quarter of the global anthropogenic emissions.
The natural carbon sinks have become more vulnerable; land and oceans sinks are impacted by climate change. We need to radically reduce fossil fuel emissions, rather than rely on natural sinks.
The map of fossil fuel emissions shows only red areas. Highest emissions are located in industrial and highly populated areas (cities). Emissions from marine transport can be seen on the major shipping routes. These maps are highly-integrated products based on observations, inventory data and models.
They reveal that we produce more emissions than the natural sinks can take up, meaning that European efforts towards carbon neutrality have not been very successful in 2021. The natural carbon sinks have become more vulnerable; land and oceans sinks are impacted by climate change. We need to radically reduce fossil fuel emissions, rather than rely on natural sinks.
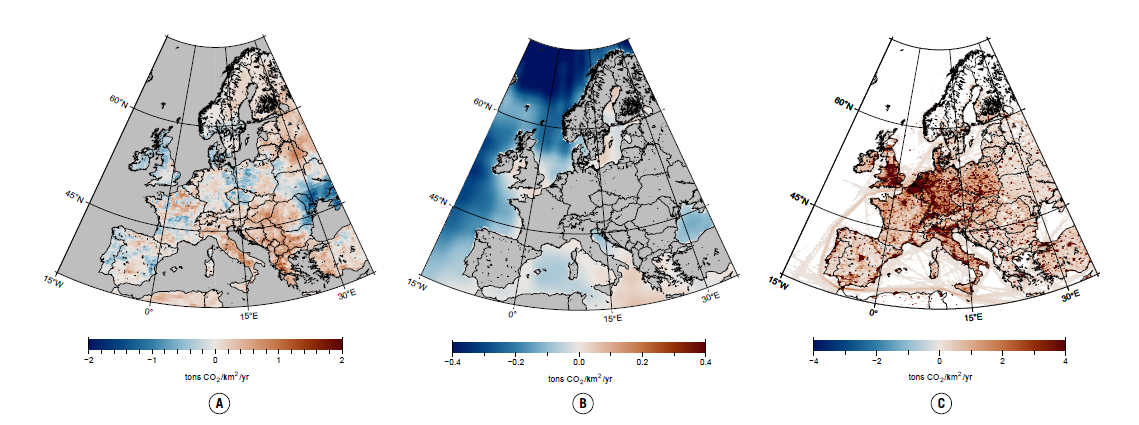
(A) Biogenic fluxes of land ecosystems,
(B) Ocean fluxes,
(C) Human emissions of fossil fuels.
(A) Biogenic fluxes of land ecosystems. This map shows the complex pattern of land ecosystem fluxes over Europe. Blue areas symbolise net carbon uptake during the year, reducing the CO₂ load of the atmosphere. Red areas symbolise net carbon loss adding additional CO₂ to the atmosphere. Italy, most of the Balkan States, Scandinavia and the Baltic countries showed carbon losses mainly due to hot and dry summer conditions. (B) Ocean fluxes. This map shows a strong carbon sink in the open ocean while coastal areas as well as the Baltic and the Mediterranean seas show a more complex pattern of both sources and sinks. (C) Human emissions of fossil fuels. This map shows the spatial distribution of fossil fuel emissions. Highest emissions are located in industrial and highly populated areas (cities). Emissions from marine transport can be seen on the major shipping routes.
These maps are highly-integrated products based on observations, inventory data and models. Note that the flux scales of the maps are different: the same colour is twice as high in fossil fuel emissions than land ecosystem fluxes, and ten times higher than ocean fluxes.